
Turning Complaints into Quantitative Insights
This write-up is intentionally vague when referencing specific product and project details. The key learnings will still be clear and the methodology should be even easier to implement in this format.
Introduction
This article introduces a methodology for assembling a spreadsheet-based, automated system for converting customer complaints into quantitative data. you might be thinking, "Hang on a second, that doesn't sound like UX design". While this project doesn't involve mock ups or wireframes or prototypes, but this kind of analysis is critical to understanding user needs. Any opportunity to uncover the scale and severity of customer issues will ensure design proposals will genuinely bring improvements to users.
You can read more about how this spreadsheet works, my methodology, and the impact it provided below. You can also download the template file and start experimenting right away.
Background
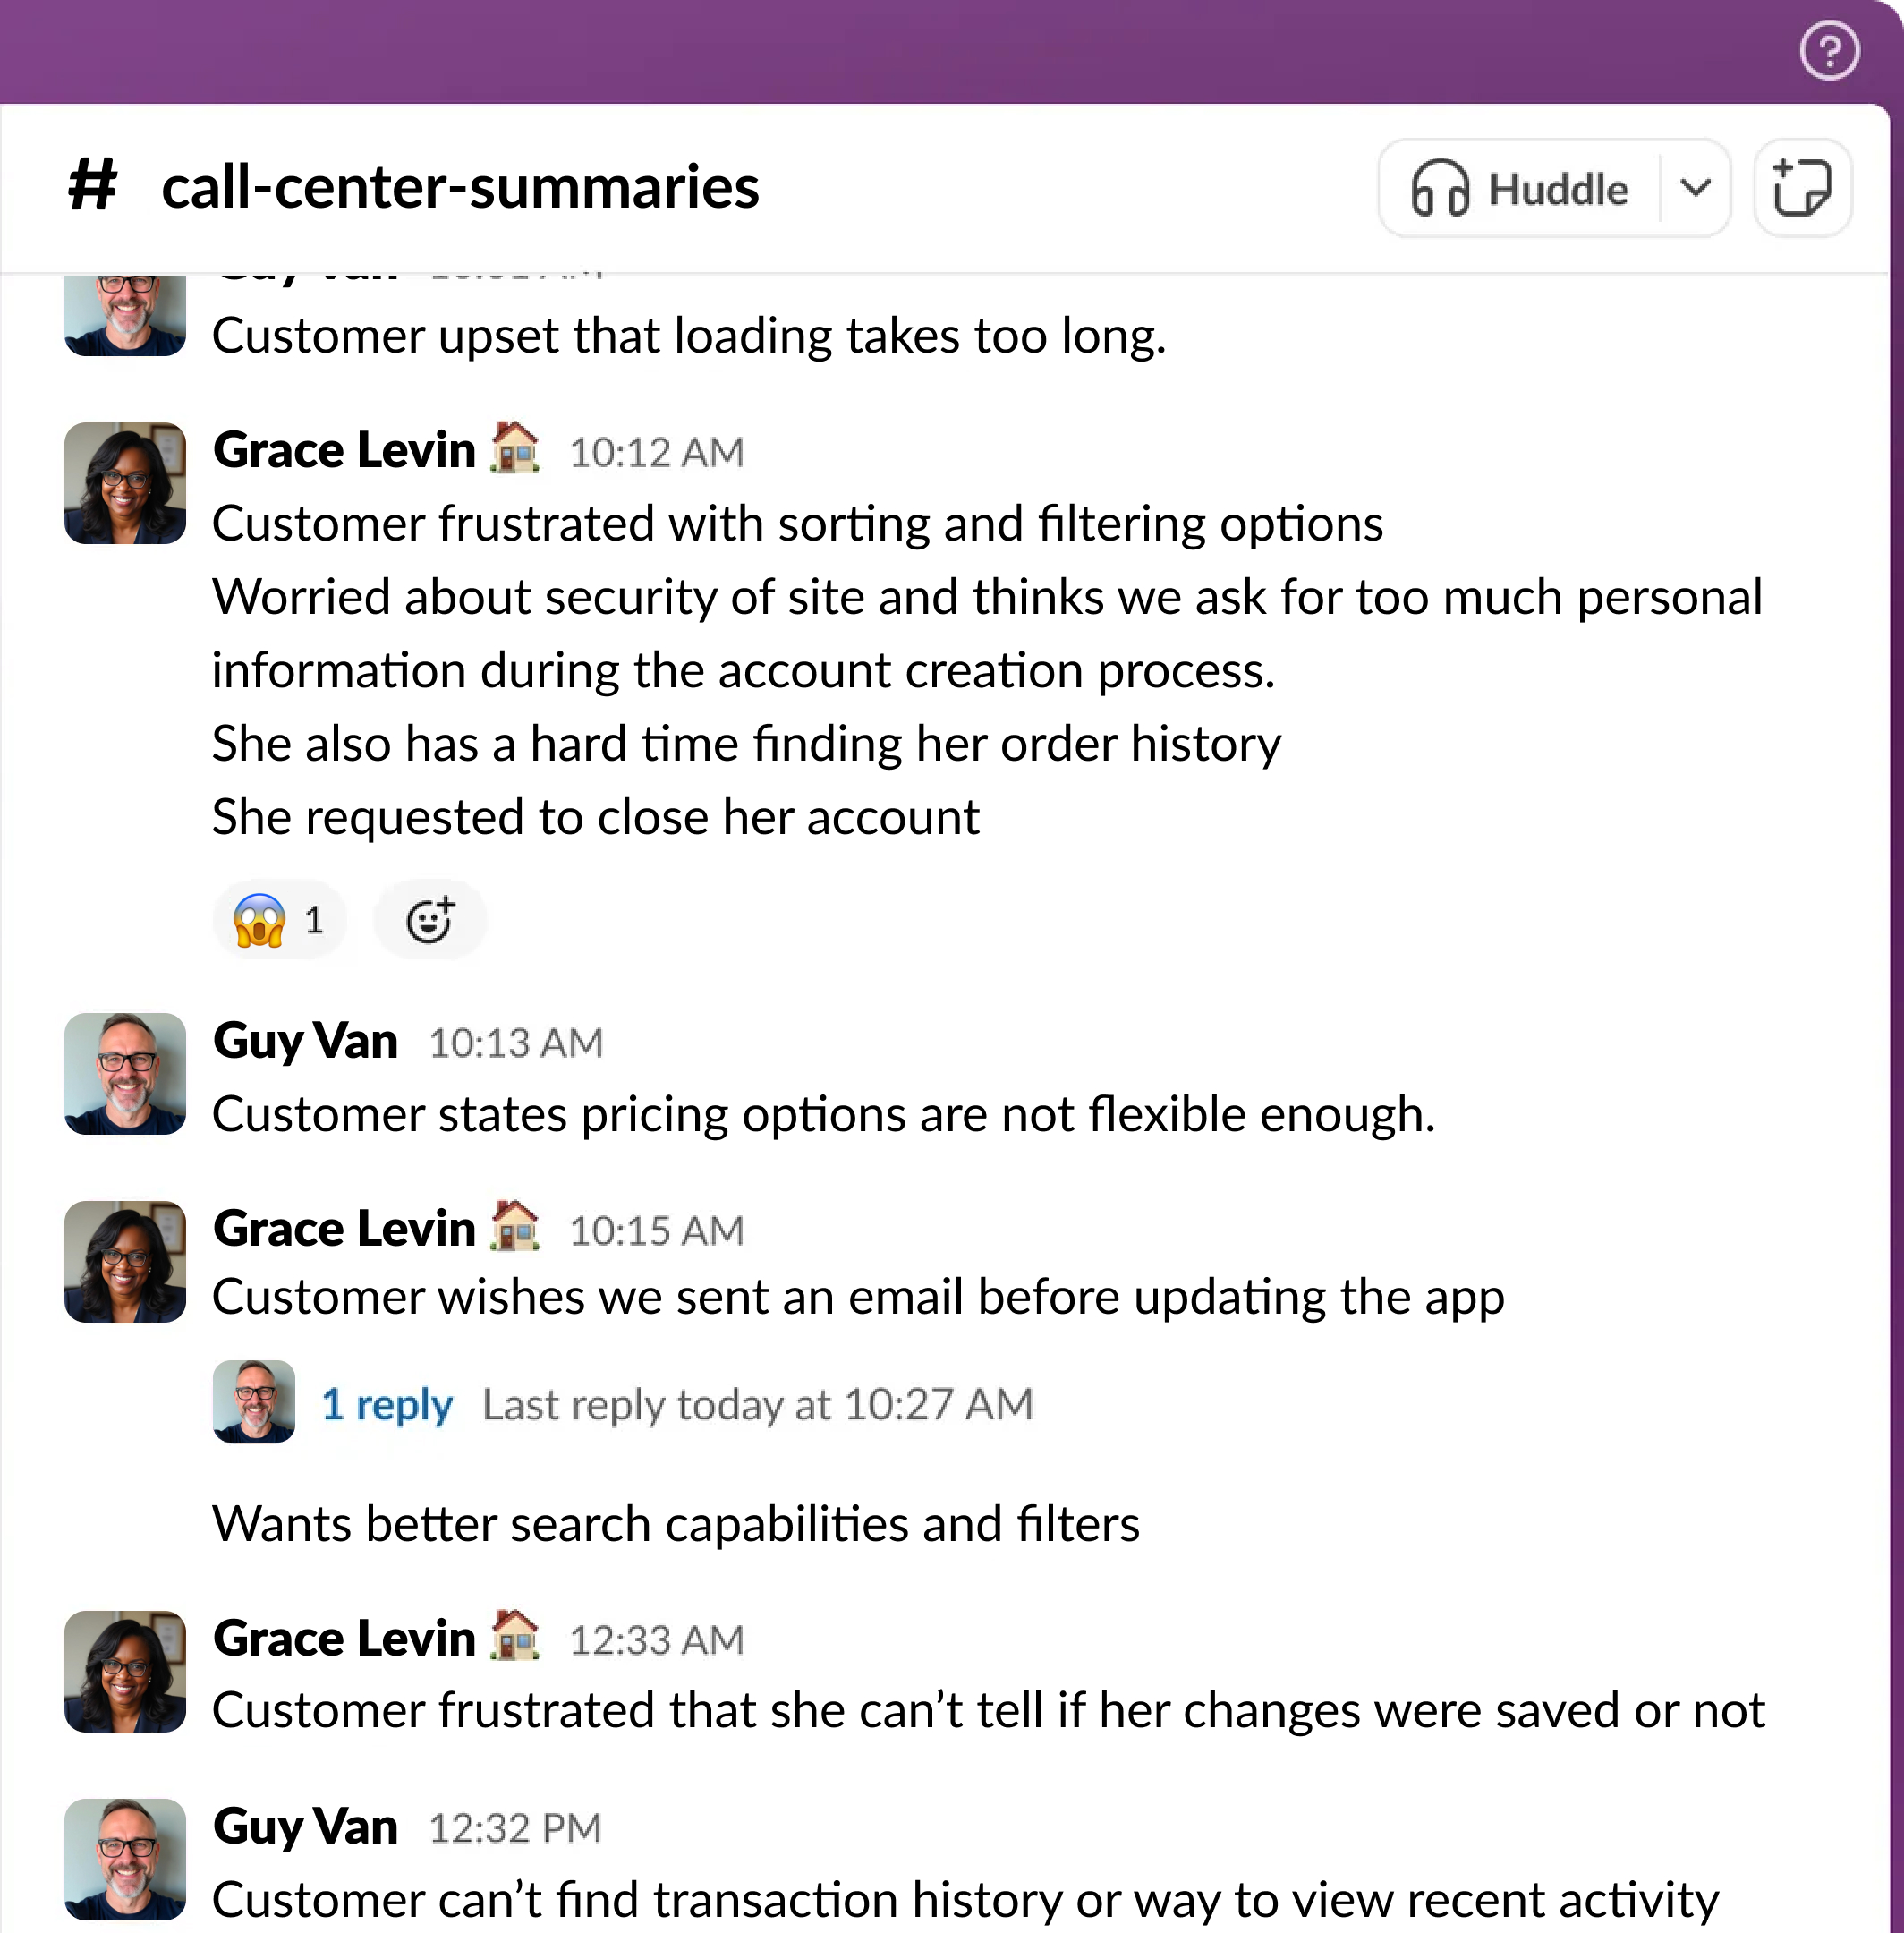
The majority of my time at Capital One has involved one of our banking products that relies heavily on a third party platform to function. While migrating between two different third-party platforms, we received a higher-than-normal call volume - almost all of which were complaints. These complaints were made available to the project team through a slack channel that served as a feed of call summaries posted by our call center agents.
Problem
The project team had access to these complaints, but we had no effective method to identify, at scale, what themes were emerging as broad-scale customer problems and which complaints were one-off inconveniences for a narrow segment of our user base.
For example, by scrolling through the feed at random and plucking out complaints here and there, it's possible to stumble upon two complaints with the same focus. Understandably, this might lead you to believe this theme is a common complaint driver. But in reality, those two complaints could be the only ones mentioning that problem - out of thousands - making this issue statistically much less significant.
Approach
In order to reveal accurate numbers within our complaints data, my first step was actually a very manual one - but I promise, the automation isn't far off. Step one involved reviewing as many individual complaints as I could and taking notes on common language across themes. Fairly quickly I had a dictionary of terms that closely aligned with specific categories. At this stage, I was able to apply these categories against the collected feedback and see results.
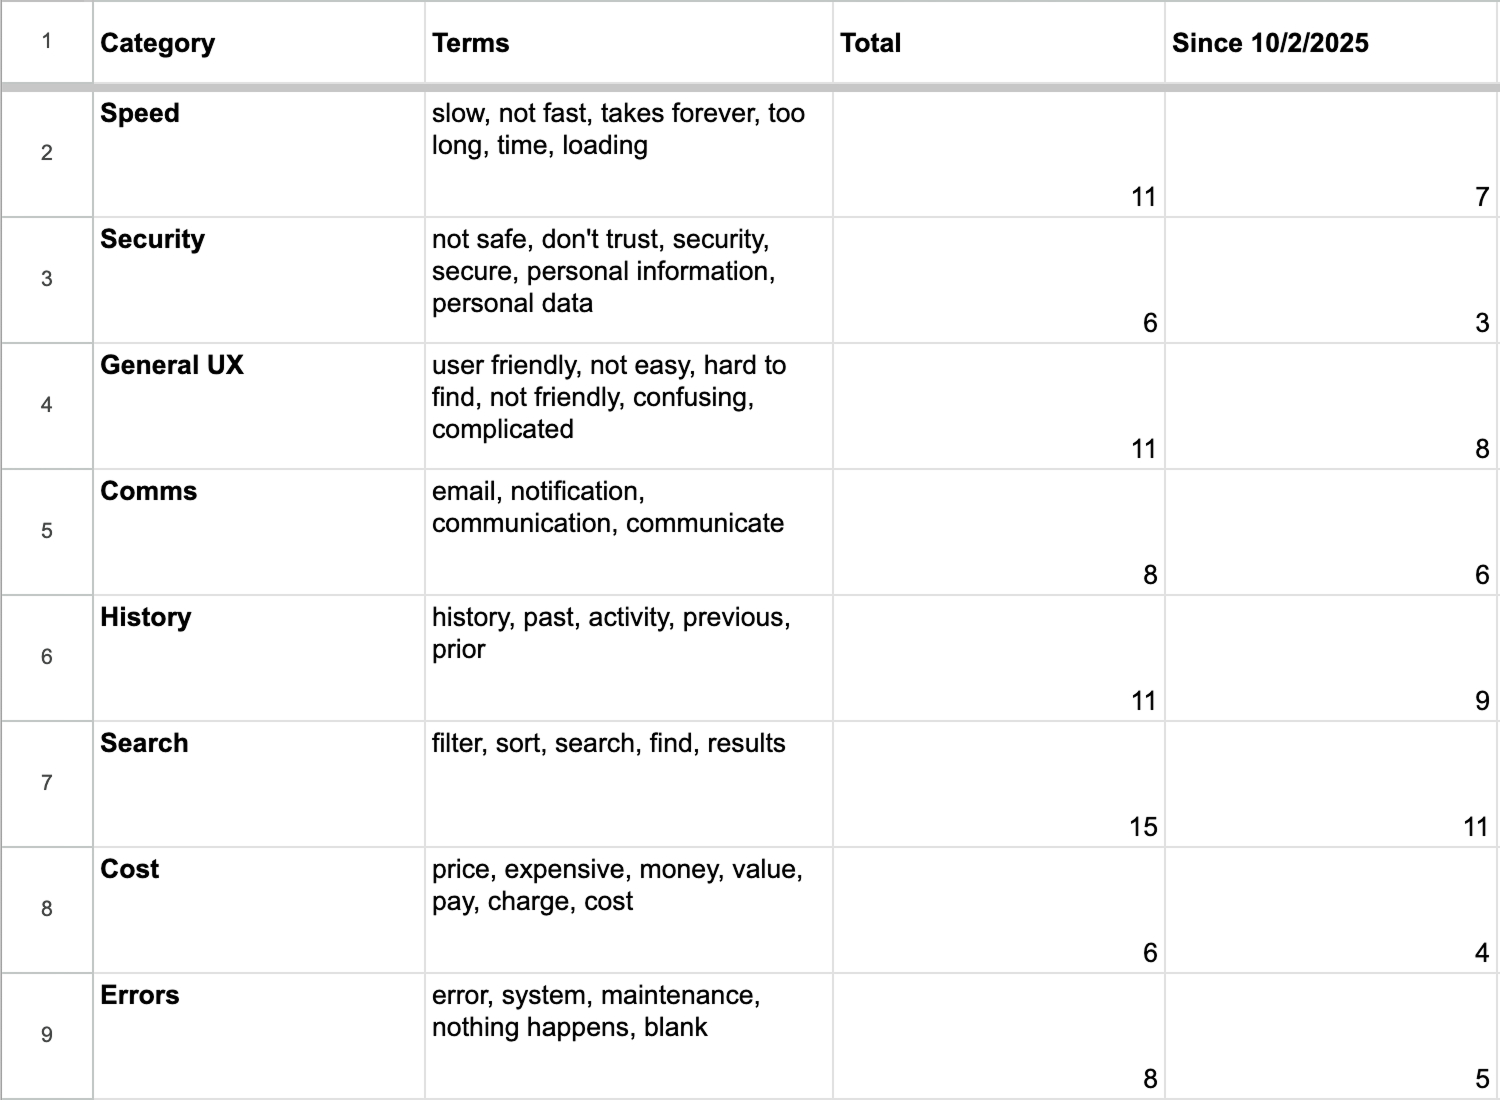
I also listed out important dates, including major updates, deployments, and migration events. I could then use these dates to generate analysis specific to those time periods. This step is purely optional, but is fantastic for tracking improvements after key deployments.
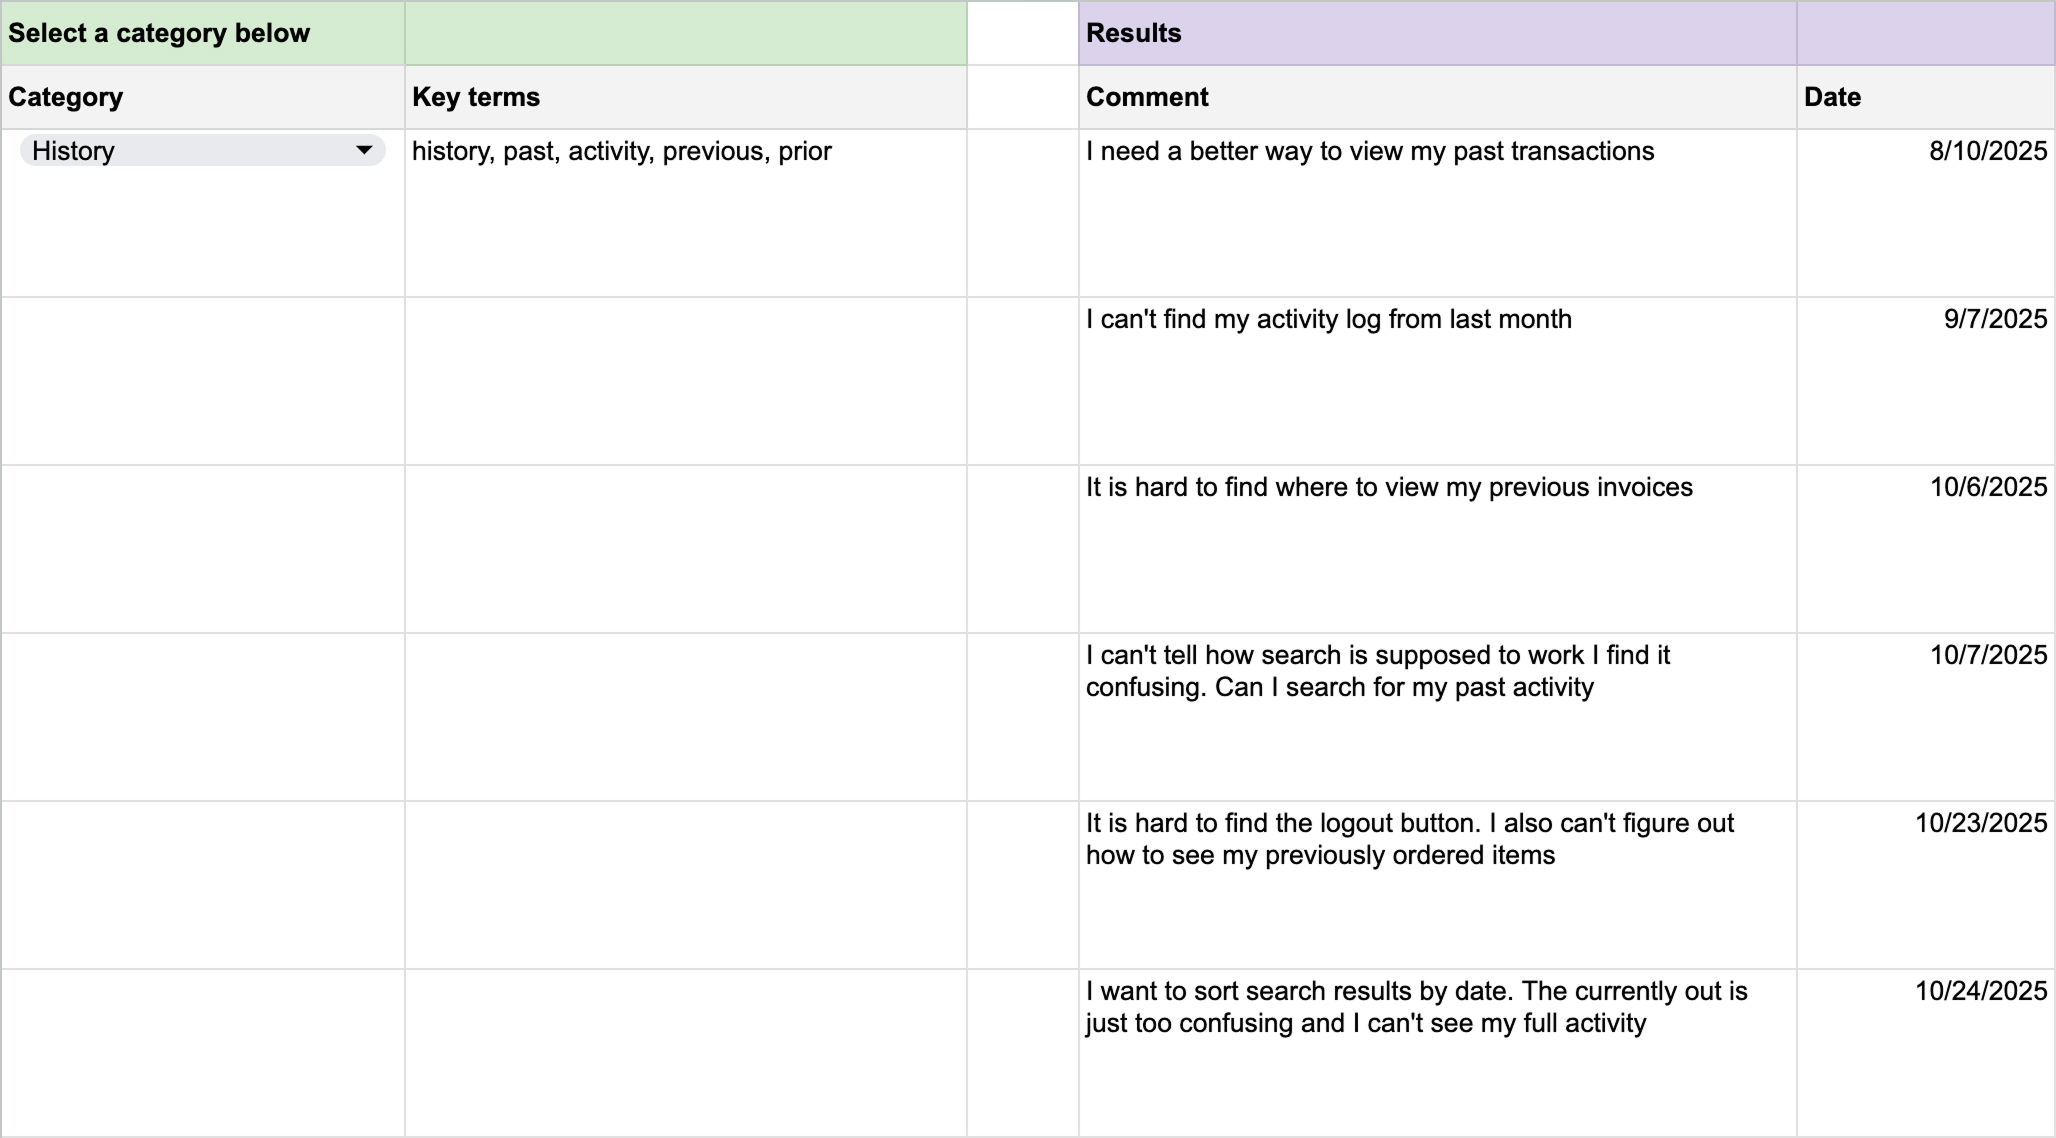
To maintain accuracy while scaling up, I added a dedicated tab for filtering all feedback down to an individual category. This way I could easily view all results for a single category and review if the target terminology is aligned with the sentiment of the feedback.
This feature also proved useful as a means of generating a report on a single category, making it easy to collect meaningful quotes directly from customers to share with partners and senior leadership when advocating for specific improvements.
Output
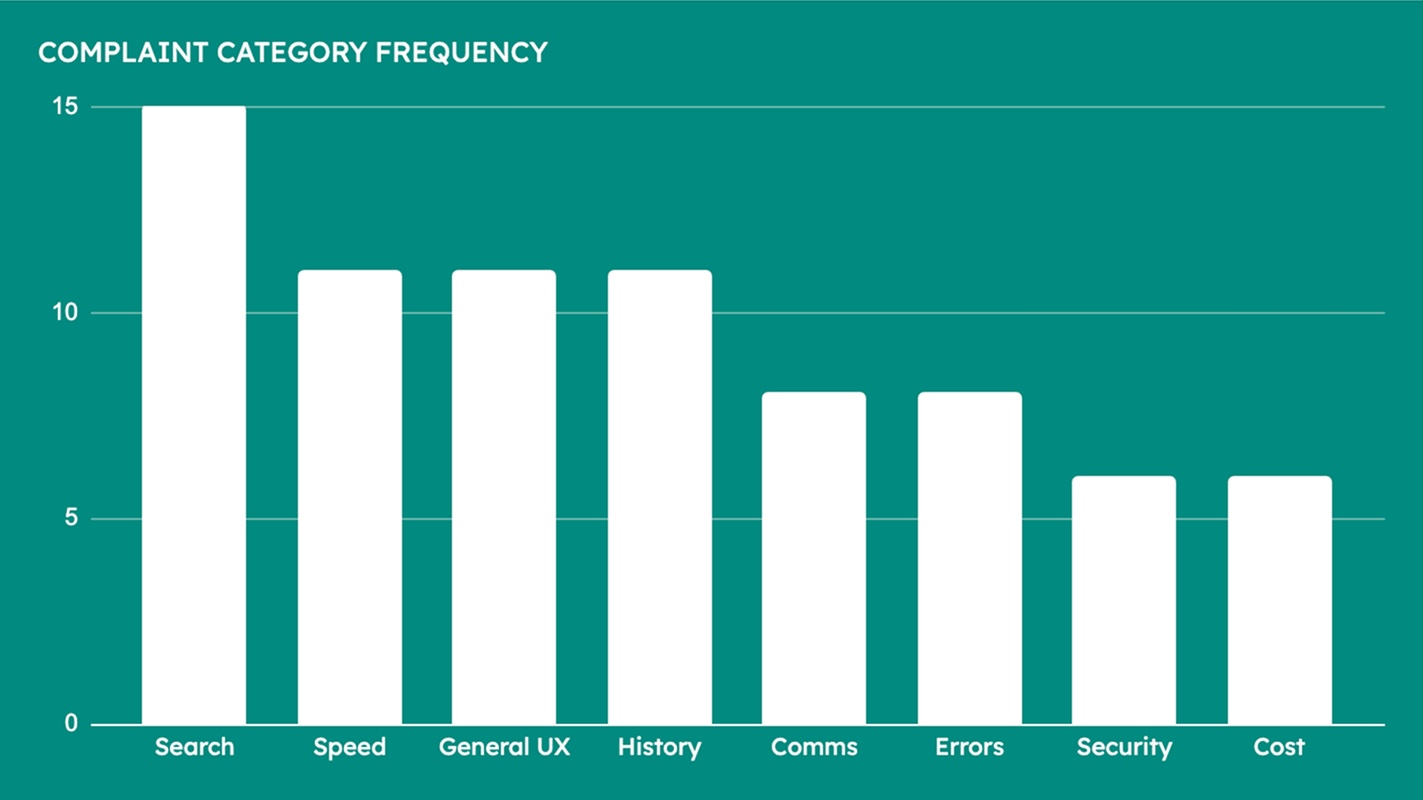
There are a variety of graphs and analysis you can produce with this data, but the items I found most valuable were:
- Category frequency (how often a topic comes up)
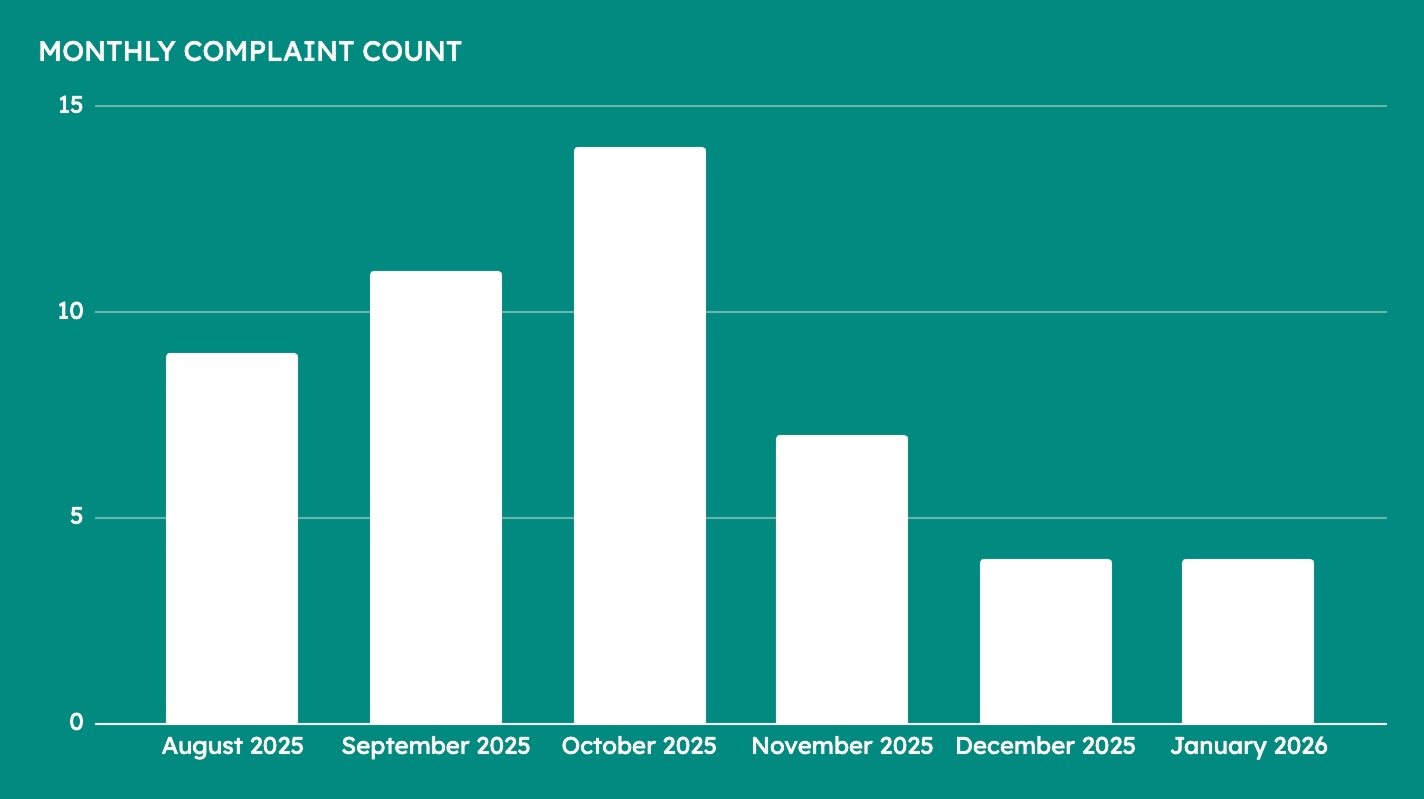
- Complaint volume per month
- The category report, mentioned above
Impact
After categorizing and bringing quantitative analysis from over 5,800 complaints, the output of this framework has had an undeniable impact on the strategic direction of our project, including:
- Informing roadmaps
- Driving feature work prioritization
- Partner alignment
- Commitment and investment from the organization
How to Implement this Framework Yourself
- First things first, you'll need a feed or collection of call transcripts or summaries.
- Download the template.
- Paste your feedback into the first tab, "feedback list"
- If the source format supports it, bulk import feedback - the more feedback you have, the more substantive the results will be.
- Build your category dictionary. Enter phrases separated by commas. It is not case sensitive.
- Don't change tab names (unless you update the tab references in the formulas yourself)
- Use the "category search" tab to check the results coming in for a particular category and finetune the category dictionary accordingly.
Key Formulas
These are the key formulas I am using to process the feedback. I'll explain the key variables in each formula to help with any modification and experimentation that would help apply this framework to different setups.
🔼 This formula points towards the feedback list found on the "feedback list" tab under column A, starting from row 2. To change this reference, look for the portion that reads 'feedback list'!$A$2:$A, swap "feedback list" for the name of your tab and any references to "A" for your target column. If your feedback starts on a different row, change the "2" to match.
🔼 Same deal for this one, except it references a date from a tab named "dates" - pretty intuitive right? This formula will only return you results from that date forward.
🔼 This formula drives the "category search" tab. This tab lets you pick a category from the dropdown, which pulls in the specific terms associated with that category from the "auto count dictionary" tab via vlookup(A3, 'auto count dictionary'!A:B, 2, False). The query function goes through the items on the "feedback list" tab and returns anything aligning with what's in "B3" which is where that vlookup is dropping the key terms for the selected category.
AI and Future Iterations
The original version of this project was completed prior to the implementation of any kind of AI tooling for internal use at this particular company.
For future iterations, I have the following recommendations.
Do:
- Use AI to help build the dictionary.
- Use AI to help identify common themes across the data.
- Use AI to structure new formulas to apply analysis data in new ways.
Don't:
- Don't use AI to help build the dictionary.
- Don't use data sets that have been bulk processed and updated by AI.
Why shouldn't you use AI to simply conduct the bulk analysis? Recent experiments using AI frequently show that numbers can easily be led astray by emphatic wording in complaint samples. For example, there may be one piece of feedback out of a thousand entries that mentions a particular topic - but if the summary is worded emphatically, AI may disproportionately weight that one entry, despite its statistical significance being 1/1000. Additionally, hallucinations are not uncommon, resulting in completely new items of feedback simply being added by the AI agent.